
Physical examination tests are evaluated regarding their accuracy and reliability in clinical research. However, the quality of research differs enormously, which is why we as practitioners have to be careful with the interpretation of their outcomes.
In this app, we are trying to rate different special tests according to a coordinate system.
For the x-axis we have decided to rate the level of evidence according to the evidence pyramid:

The y-axis reflects the power of the physical examination test according to its statistical power, which is derived from the positive or negative likelihood ratio.
According to common Guyatt et al. (2002), likelihood ratios are interpreted as following:
|
LR+ |
Interpretation |
LR- |
|
1-2 |
Alters post-test probability of a diagnosis to a very small degree |
0.5-1 |
|
2-5 |
Alters post-test probability of a diagnosis to a small degree |
0.2-0.5 |
|
5-10 |
Alters post-test probability of a diagnosis to a moderate degree |
0.1-0.2 |
|
>10 |
Alters post-test probability of a diagnosis to a great degree |
<0.1 |
However, hardly any special test has an LR+ of above 10 or an LR- less than 0,1. In most cases, the accuracy of tests is significantly weaker, which is why we decided to divide the y-axis into three categories: weak (LR+ < 2.5, LR->0,4), moderate (LR+ 2,5 – 5, LR- 0,2-0,4) and good (LR+ >5, LR-<0,2).
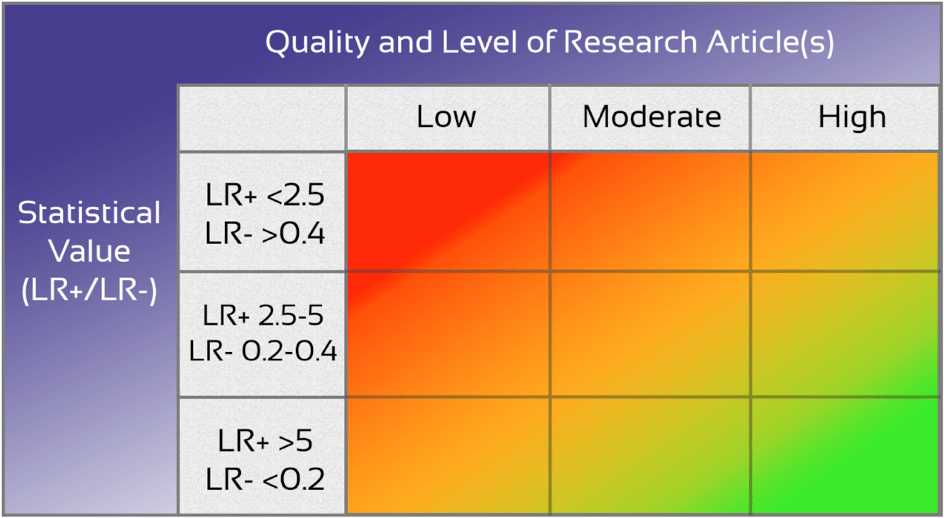
It is important to realize that this system is not clear-cut. On the one side, the difference between the quality of an research paper can be enormous and on the other side the diagnostic accuracy of a test to make a diagnosis more likely (LR+) can be great, while its accuracy to render a diagnosis less likely (LR-) can be weak.
Therefore, our clinical value matrix is a flexible structure and based on our subjective clinical expertise, designed to give you as a reader a rough guideline:
Red: Weak clinical value (if the statistical value is low or if the test is not evaluated well)
Orange: Moderate clinical value (if the statistical value is moderate or the test is not evaluated with a systematic review or meta-analysis)
Green: Strong clinical value (if the statistical value is high and the test is evaluated in a review or meta-analysis)
Gray: Questionable clinical value (in case there is no research conducted yet or statistical value is unknown)